Making the Database of Adverse Event Notifications more accessible
The Database of Adverse Event Notifications (DAEN) is the publicly accessible subset of the Adverse Event Management System (AEMS), both are managed by the Therapeutic Goods Administration (TGA) in Australia. This is similar to VAERS, the US based Vaccine Adverse Event Reporting System. The benefit of VAERS is that you can download .csv files and easily import the data sets in excel or whatever statistical analysis package you want to use. Unfortunately, DAEN only provides the information in html tables spanning multiple pages. Not an ideal situation for analysis, and getting results from queries is very slow.
I decided to scrape the information in DAEN related to the COVID-19 vaccines so I could keep track of what was going on. Some reports in DAEN are added or removed months later, so there may be a few differences in the data set I have scraped and the most up-to-date data on the DAEN website. The scraped data can be found here.
It should be noted that there will be some reports in DAEN where the COVID-19 vaccine is listed as suspected, but the symptoms were not actually related to the vaccine. It is also important to note that the database is almost certainly massively under-reporting AEs (Adverse Events). The DAEN page states:
Adverse event reports from consumers and health professionals to the TGA are voluntary, so there is under-reporting by these groups of adverse events related to therapeutic goods in Australia. This is the same around the world.
I will be attempting to determine the rate of under-reporting in a later post by using ambulance records.
The TGA decided that the time between an adverse event report being added to AEMS and being publicly accessible on DAEN needed to be changed from 90 days to 14 days from 18 August 2021. I am really glad they made that change.
If you want perform any analysis on the DAEN data, I would suggest visiting my github repository which is usually updated on weekdays.
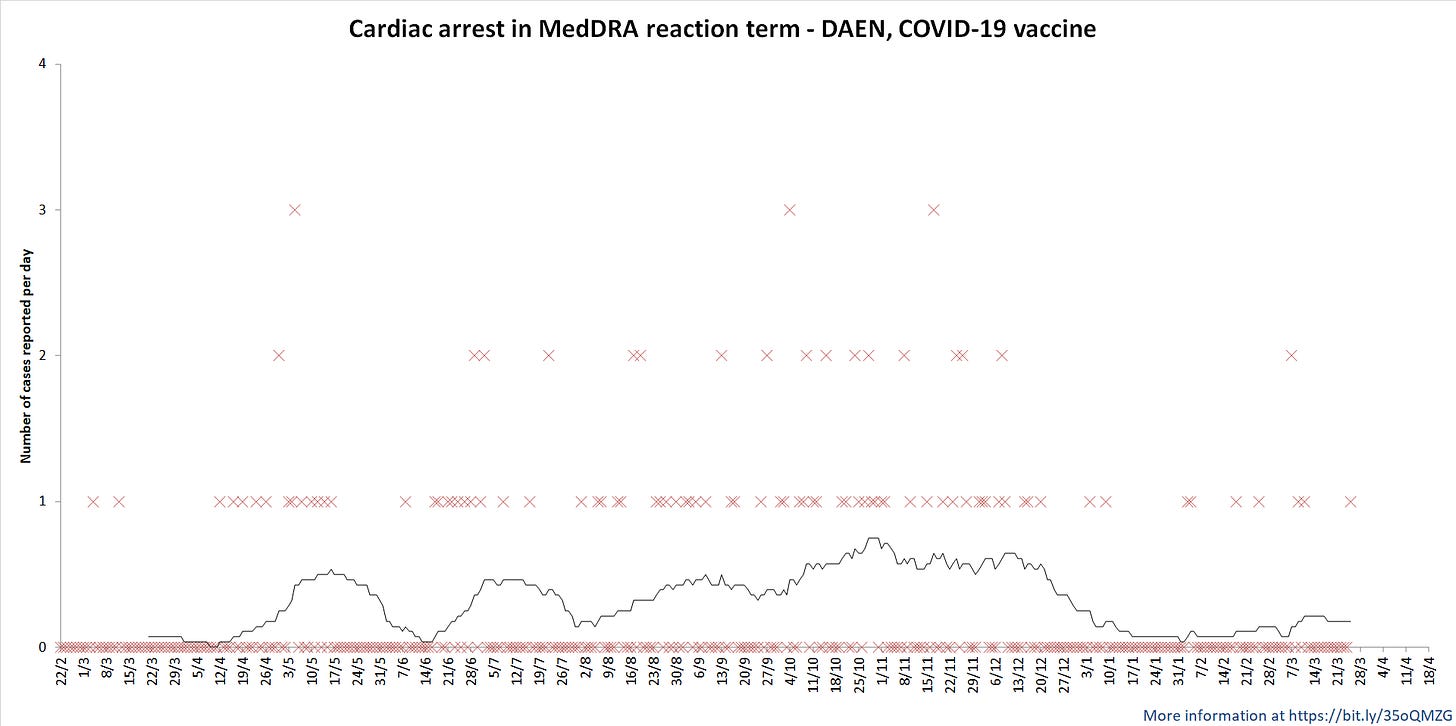
Below are some of the graphs that I produced from the DAEN information. Please note that these are not being updated here as I currently don’t know how to embed images directly from github in substack. Figure 1 shows some of the basic information such as number of adverse events and deaths reported each day for the COVID-19 vaccines, myocarditis, pericarditis and the more general term cardiac disorder. The most common MedDRA reaction terms in the Cardiac disorders classification are also listed. All dates are in the day/month or day/month/year format, the black line is a 28 day moving average.
Figure 2 shows number of reported cases grouped by age for myocarditis and pericarditis from the COVID-19 vaccine. Figure 3 shows how the numbers have progressed over time in an animation. The age groupings were selected to match age groupings from vaccine rollout data.
Figure 4 shows the DAEN entries with ‘error’ in the terms with a 28 day moving average. The most notable number of errors were seen on 1/11/2021 where a number of 'Expired product administered' was recorded, and 5/11/2021 where numerous teenagers were incorrectly given AstraZeneca which was recorded as ‘Wrong product administered’. There have also been cases of ‘Incorrect dose administered’ with 5-11 year old children which presumably means a young child received an adult dose (three times the dosage). I wonder how many errors there were that didn’t get reported…
A fairly striking pattern emerges when looking at DAEN entries with ‘Cardiac arrest’ with a 28 day moving average as seen in Figure 5. You can see multiple waves of hearts stopping.


