South Australian Ambulance Service records and the COVID-19 vaccines
There are a few locations in the world that kept SARS-CoV-2 from spreading through the community. South Australia was one of those locations with only 918 cases to 29 October 2021 in a population of 1.77 million. The vast majority of those cases were from people arriving in the state and not from community transmission. The spread in the community didn't really start until mid-December 2021. This means that South Australia has a fairly unusual situation where any adverse events from the vaccine would not be confounded by exposure to the SARS-CoV-2 virus. Only 0.05% of the South Australian population got the virus but 81.8% of people 12 or older received one dose and 66.3% of people aged 12 or older were 'fully vaccinated' with a COVID-19 vaccine by 31 October 2021.
Comparing ambulance calls in October 2021 with October 2019
The South Australian Ambulance Service (SAAS) has provided ambulance call out data for October 2019 and October 2021 via Freedom of Information request FOI-2021-00201. The year of 2019 was the most recent 'normal' year and used as the reference. The month of October was chosen due to a large number of children receiving the second dose of a COVID-19 vaccine. The information in Table 1 came from the doses administered to 30 September 2021 and to 31 October 2021. Unfortunately, it was not possible to get a larger data set from SAAS in a timely fashion, the month chosen for comparison was October. A significant portion of the October vaccinations were in the 12-15 age group.
Table 1, Calculating the number of COVID-19 vaccine doses administered in October 2021.
It is difficult to know what the cause of an increase in ambulance calls would be. It is possible that it could be related to vaccine injuries, or it could be from other causes, so care needs to be taken in drawing conclusions from this data set.
How this data set was analysed
The data set used in analysis can be found in the github repository here. The age information needed a lot of work. Some of the cleaning could be done by automated processes, but a noticeable portion needed manual intervention. Some calls are repeated a few minutes after the first call. These repeat calls needed to be removed without removing valid new calls. If a call was received within 30 minutes of another call which had the same age, sex and event profile then the duplicate call was removed. The threshold of 30 minutes seemed like a reasonable balance between excluding most of the duplicate calls and not excluding possible real calls with the same profile.
Figure 1. Comparing histograms of the time difference between calls matching the same age, sex and event for SAAS calls in October 2019 and October 2021.
Population information for each age group at the two time points was collected from the Australian Bureau of Statistics (ABS data is actually 30 June estimate, but the relative number of 30 June 2019 to 30 June 2021 should be a similar ratio for October 2019 to October 2021.
Analysis was performed in R. All ambulance callouts related to other agencies were removed because they didn't appear to add any useful information (e.g. an event labelled TRANSFER, TRANSPORT etc.). Information was extracted for a selected age group. If an event (e.g. a Chest Pain call) occurred three times or less in a month in October 2019 or October 2021 in the selected age group, then it was excluded from downstream analysis. If the sum of calls for a particular event for a specific age group (adding both Oct 2019 and Oct 2021 events) was less than 10 times then it was also excluded. This kept the error bars from vary infrequent events from dominating the graph. Fisher's exact test (fisher.test) was used to perform the analysis, which calculated the odds ratio, the upper and lower limits for the 95% confidence interval and the p-value. The p-value was adjusted for multiple comparisons using the Benjamini & Hochberg adjustment. Graphs were generated using ggplot2.
There were a large number of missing entries in the AGE column of the source data. An attempt was made to determine what those missing entries might have been by finding the total number of entries for an event and the number of entries for that event which had age information. A scaling factor was applied to attempt to correct for this, but there are potential problems with this. It might be more likely that someone calling an ambulance for a 16 year old having a stroke would know the age of the patient than someone calling for a much older patient, so the scaling factor might have less relevance to younger age groups.
Please be aware that the normal seasonal influenza did not occur over the last two years in South Australia. There will be some unusual distortions in the health profile of the extremely old and frail population because normally the seasonal flu would kill a sizable portion of that population.
There are some differences that are unexpected. A significant decrease in 'Unconscious / Fainting (Near)' in some age groups and a significant increase in 'Traumatic Injuries (Specific)' in some age groups. A possible explanation for the significantly lower numbers of 'Unconscious / Fainting (Near)' events could be due to the unusually hot October in 2019 and the relatively mild October in 2021.
How to read the graphs
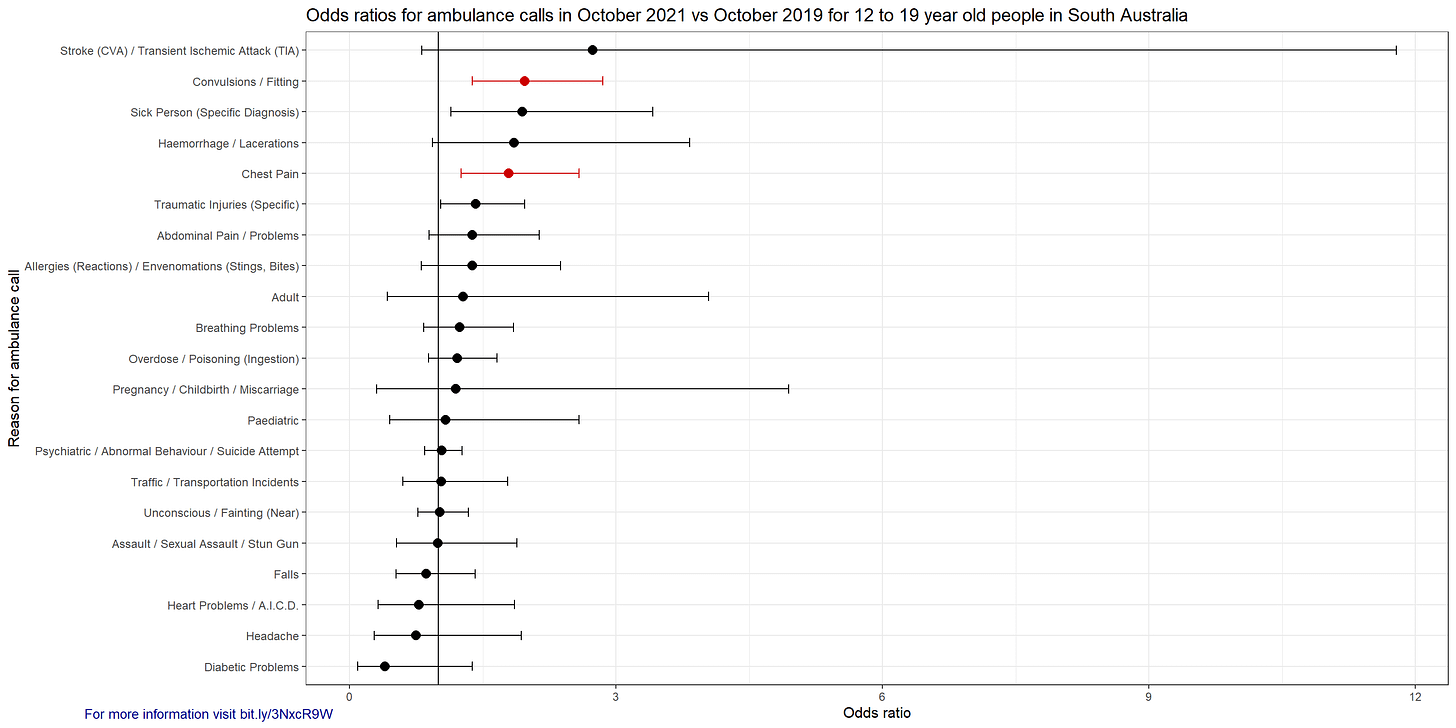
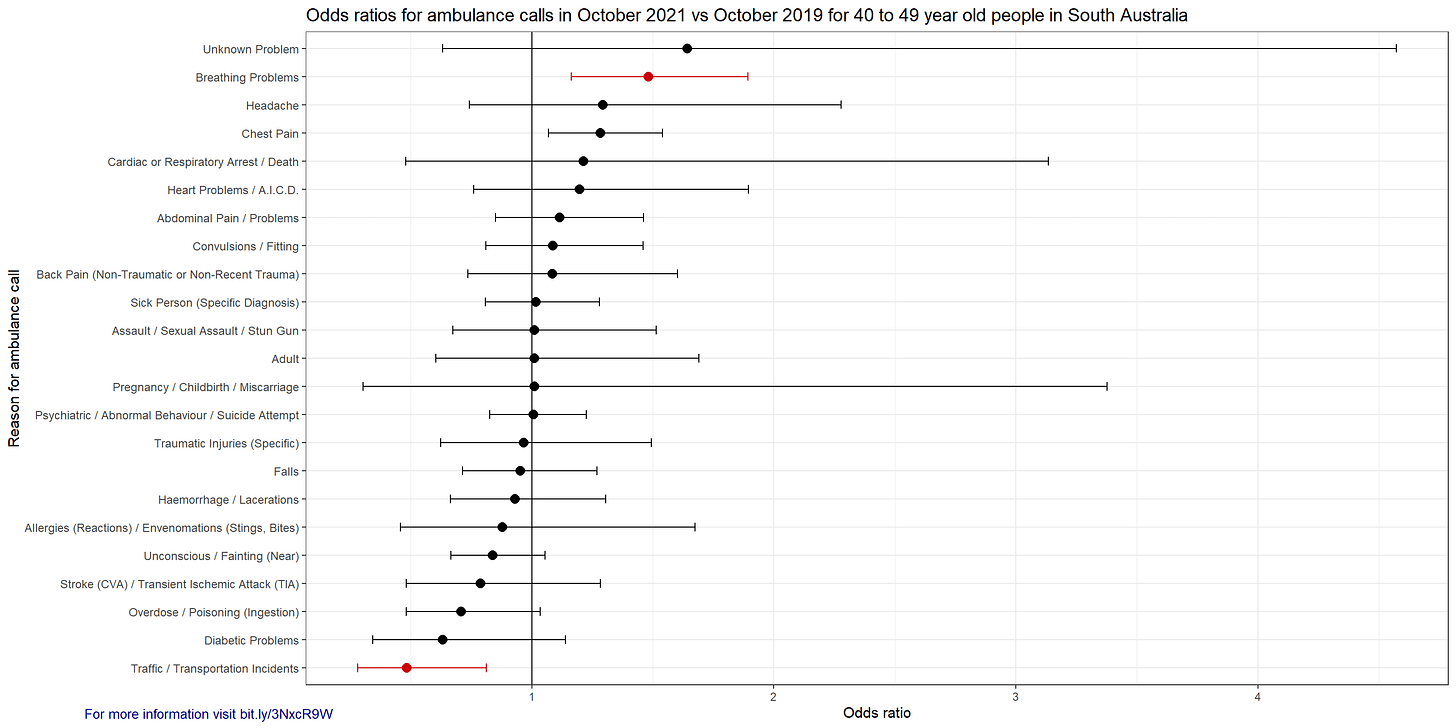
If an odds ratio is above one, then that means there was an increased chance of that event occurring and below one means a decreased chance. For example, if the odds ratio of 'Convulsions / Fitting' in 12 to 19 year old children was 2.0 then the chance of a call being made for a 12 to 19 year old for 'Convulsions / Fitting' in October 2021 was 2.0 times the rate of October 2019 (increased by 100%). For this specific category there were 48 calls in October 2019 and 95 calls in October 2021. The ABS estimate for the population in this age group was 163,790 and 164,599 in October 2019 and October 2021 respectively. The error bars show the 95% confidence interval and red indicates statistical significance (p-adjusted < 0.05). Very wide error bars usually indicate a very small number of events occurred (for example, in October 2019 there were four ambulance calls for 'Stroke / TIA', but 11 calls in October 2021 for 12 to 19 year old children/teenagers. These graphs don't indicate the cause of the differences in ambulance calls in the two compared months. It could be the COVID-19 vaccines, it could be something completely different. The graphs with '(scaling for missing ages)' in the title attempt to apportion the entries with unknown ages, but as mentioned above, there are potential errors introduced with this.
The graphs
For reference this is 0-11 year old children. This group did not receive vaccines, the 5-11 year old children could get the first dose in Jan 2022. I can’t really expain the decreases in some of these groups. I haven’t understood what ‘Adult’ means in this context either.
Here is everyone that could get a vaccine in one large group of 12 to 100 years old.
Discussion/notes
There appears to be a significant increase in ambulance calls for 'Convulsions / Fitting' and 'Chest Pain' in the 12 to 19 year old group. This age group was given a notable proportion of the COVID-19 vaccine doses in SA in October. While 'Stroke (CVA) / Transient Ischemic Attack (TIA)' was not a statistically significant increase for that age group, it looks like it is worthy of further investigation.
Looking at the 12 to 100 year old age grouping, I suspect the increase in 'Carbon Monoxide / Inhalation / HAZMAT / CBRN' calls was mostly from suicide attempts. There were six calls in Oct 2019 and 21 in Oct 2021, and 11 of the 2021 calls mentioned the word suicide in the 'EVENT SUB TYPE' column. This would also fit with the increase in 'Psychiatric / Abnormal Behaviour / Suicide Attempt'. I suspect the mental health issues resulting from inappropriate government responses to the pandemic and media hysteria will be for the history books.
There was a substantial increase in calls for palliative care patients and cardiac or respiratory arrest and death. I am cautious to draw any conclusions from those events without further information. I suspect the lack of seasonal flu could create significant distortions, but it is certainly worthy of further investigation.
I am not sure why animal bites and attacks would be increased, perhaps due to the increase in people getting pets for company as substitute for human contact.
The increase in 'Unknown Problem' and 'Sick Person' could well be from the vaccines. Definitely worthy of further investigation.
Some of the allergies calls were definitely from the COVID-19 vaccines. Some calls included the text 'Injection administered' in the ' EVENT SUB TYPE' column, but this was also the case for some 2019 calls. This was not a statistically significant increase in 2021 compared with 2019.
The increase in 'Traffic / Transportation Incidents' is quite surprising as many people were working from home and driving less.
The increase in falls could be due to elderly people attempting to do more themselves rather than asking for help. But that is just speculation.
I think it would be fairly safe at this point to say that the increase in chest pain calls is mostly or exclusively due to COVID-19 vaccine adverse events.
The significant decreases in 'Unconscious / Fainting (Near)' and 'Heat / Cold exposure' can probably be explained by the abnormally hot October 2019 and the mild October 2021 as discussed above.
If you are a statistician and you can see an error in my analysis then I am very interested to hear your perspective. Please feel free to take this data set and do your own analysis. Perhaps you can come up with a better way of detecting and excluding repeat calls.
Please check out my previous article on making the Database of Adverse Event Notifications accessible.


